Analyzing performance results
Performance result collections can be analyzed and visualized in different ways, namely:
- non-interactively as an operation (
pySPACE.missions.operations.comp_analysis)- interactively using the script pySPACE/gui/performance_results_analysis.py.
The performance results analysis GUI
The script pySPACE/gui/performance_results_analysis.py
invokes first a “choose file” dialog in which the results.csv file
of the PerformanceResultSummary has to be selected.
Once a file has been selected,
the PerformanceResultSummary is loaded and the main GUI is started.
The main GUI has the following structure:
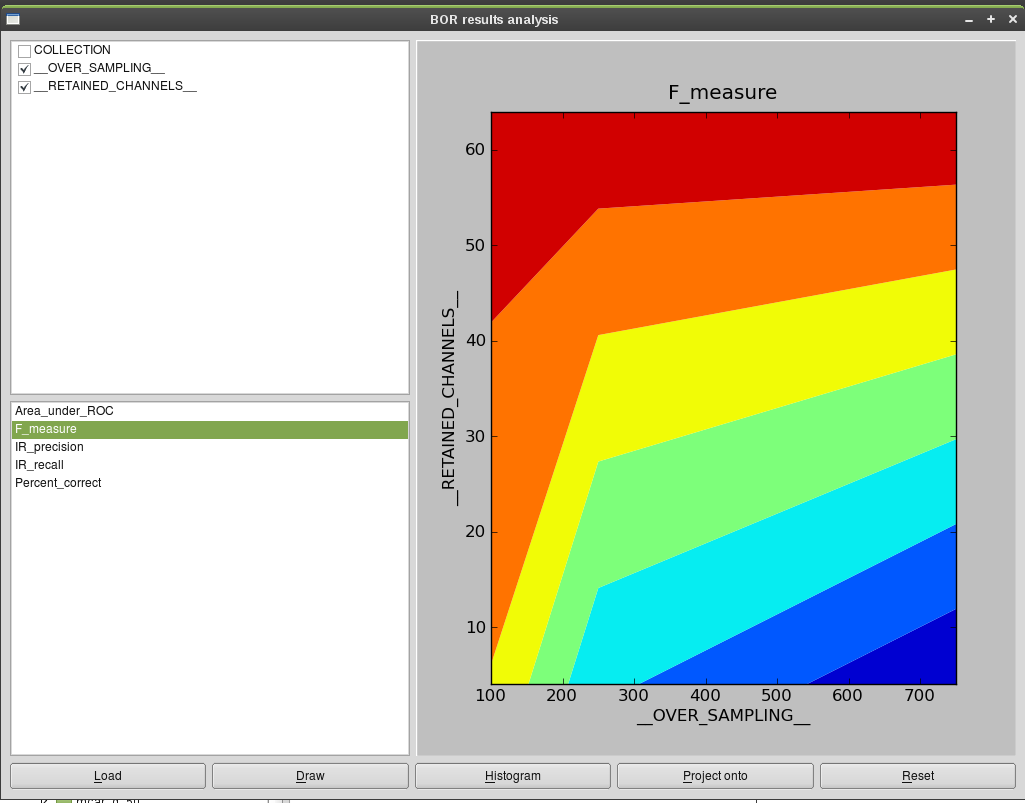
In the upper left box, one or two variables can be selected whose effect onto a metric shall be analyzed. In the lower left box, a metric can be selected. Pressing the Draw-Button generates a plot with the selected variables as axes and the metric as value. Pressing the Histogram-Button generates a histogram of the value the chosen metric takes on. The Load-Button launches another choose file-dialog that allows to select an other results.csv file.
The Project onto-Button creates a pop-up window:
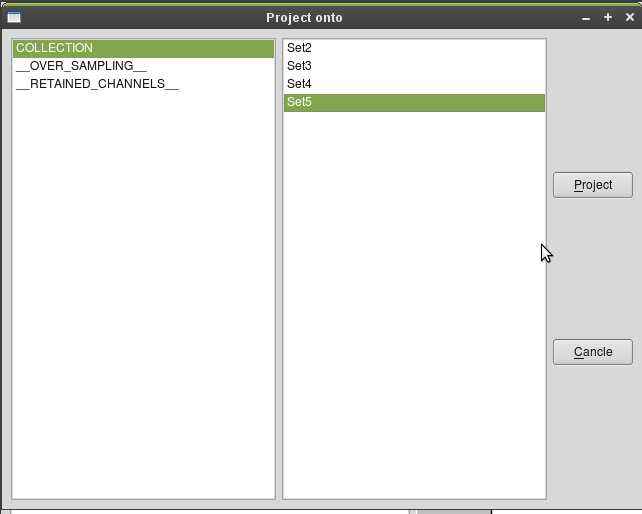
In this pop-up window, one can select a parameter and a certain value for this parameter. The Project-Button projects the loaded PerformanceResultSummary onto the subset of items, where the chosen parameter takes on the specified value. This is useful if one is e.g. interested in the performance achieved on one input collection (when a set of collection has been processed). In the example shown in the figure, one would project onto the collection “Set5” and ignore the results achieved on the collection “Set2”, “Set3”, and “Set4”.
As new part, a set of values can be selected for projection and you get a list of currently made projections in the line above the buttons.
The Reset-Button in the main GUI undoes all projection performed.