performance_results_analysis
Module: run.gui.performance_results_analysis
Simple Gui for loading and browsing pySPACE.resources.dataset_defs.performance_result
For more documentation have a look at Analyzing performance results!
Note
Due to import problems, matplotlib import was shifted to main method.
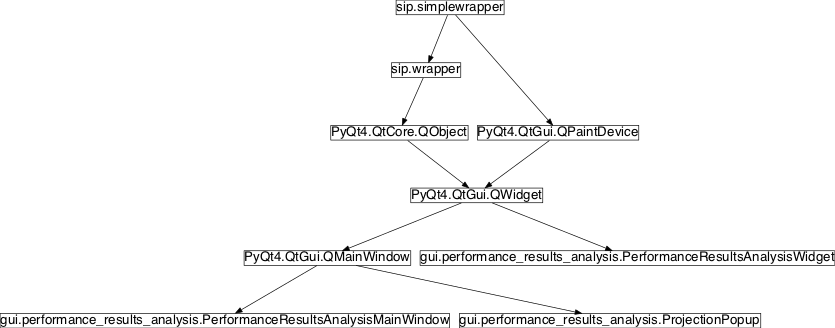
Inheritance diagram for pySPACE.run.gui.performance_results_analysis:
Class Summary
ProjectionPopup(main_window, \*args, \*\*kwargs) |
A pop up window that allows to specify the projection of the data. |
PerformanceResultsAnalysisWidget([...]) |
The main window of the performance results analysis GUI |
PerformanceResultsAnalysisMainWindow([...]) |
The main window for analysis |
Classes
ProjectionPopup
-
class
pySPACE.run.gui.performance_results_analysis.ProjectionPopup(main_window, *args, **kwargs)[source]¶ Bases:
PyQt4.QtGui.QMainWindowA pop up window that allows to specify the projection of the data.
This pop up window allows to select a parameter and its desired value. The result collection currently loaded in main_window is then projected onto the subset where the chosen parameter has the chosen value.
For more intuitive usage, the process is named Filter.
Class Components Summary
_cancel()Cancels projection _create_central_widget()Create central widget of the pop-up _project()Called when user presses “filter” button _value_selected([selected, deselected])Handle the selection of a new value by the user _variable_selected(selected, deselected)Handle the selection of a new parameter by the user -
_variable_selected(selected, deselected)[source]¶ Handle the selection of a new parameter by the user
-
_value_selected(selected=None, deselected=None)[source]¶ Handle the selection of a new value by the user
-
PerformanceResultsAnalysisWidget
-
class
pySPACE.run.gui.performance_results_analysis.PerformanceResultsAnalysisWidget(results_file=None, parent=None)[source]¶ Bases:
PyQt4.QtGui.QWidgetThe main window of the performance results analysis GUI
Parameters
swap: Switch between zero and one to change different between two different printing cases.
This is yet implemented in nominal vs. nominal plots to switch in the presentation which parameter defines the main differentiation and in numeric vs. nominal to activate some dependent display of functions with a hidden parameter, to show performance differences in time and Balanced_accuracy.
Class Components Summary
_create_elements()Create elements of this widget _draw_histogram()Draw a histogram of the current collection for the specified metric _draw_plot()Draw a plot for the selected variable/metric combination. _get_selected_items(items)Determine selected items from a list of items _load_results_collection_from_file([file_name])Load results collection from file _load_roc_curves()Load the collection of ROC curves. _project_onto(selected_variable, selected_values)Project onto the data where selected_variable has the values selected_values. _project_popup()Create ‘Filter’ pop up window _reload()Reinitialize and load new result file _reset()Reset working collection to originally loaded one _save()Stores the current figure to a file _update_variable_selection()Updates the selection box for variables