metric
Module: resources.dataset_defs.metric
Methods to calculate and store classification results (metrics)
Several performance measures are supported.
To combine and visualize them, use the
PerformanceResultSummary.
For details concerning parameters in metric calculation, have a look at
PerformanceSinkNode.
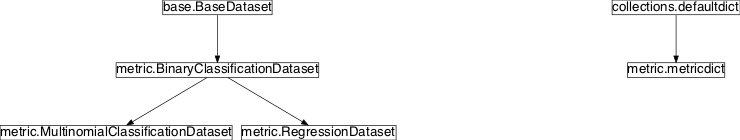
Inheritance diagram for pySPACE.resources.dataset_defs.metric:
Class Summary
metricdict |
Interface to dictionaries of metrics |
BinaryClassificationDataset([dataset_md, ...]) |
Handle and store binary classification performance measures |
MultinomialClassificationDataset([...]) |
Handle and store multiclass classification performance measures |
RegressionDataset([dataset_md, dataset_pattern]) |
Calculate 1-dimensional and n-dimensional regression metrics |
Classes
metricdict
-
class
pySPACE.resources.dataset_defs.metric.metricdict[source]¶ Bases:
collections.defaultdictInterface to dictionaries of metrics
Class Components Summary
__missing__(new_key)Return first occurring fitting entry and give warning, if functional metric is called without parameters -
__missing__(new_key)[source]¶ Return first occurring fitting entry and give warning, if functional metric is called without parameters
-
__weakref__¶ list of weak references to the object (if defined)
-
BinaryClassificationDataset
-
class
pySPACE.resources.dataset_defs.metric.BinaryClassificationDataset(dataset_md=None, dataset_pattern=None)[source]¶ Bases:
pySPACE.resources.dataset_defs.base.BaseDatasetHandle and store binary classification performance measures
This class derived from BaseDataset overwrites the ‘store’ and ‘add_split’ method from the BaseDataset class so that it can handle and store classification performance measures to files.
In the following there is a list of implemented metrics. After giving the normal name or abbreviation, the name in the final results file/dictionary is given. This is for example needed for parameter optimization algorithms.
Metrics
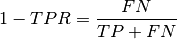
confusion matrix components: TP - True_positives: correct classified examples or the ir_class (positive examples) TN - True_negatives: correct classified examples or the ir_class (negative examples) FN - False_negatives: wrong classified positive examples (classified as negative examples) FP - False_positives: wrong classified negative examples (classified as positive examples) confusion matrix metrics: TPR - True_positive_rate: true positive rate, recall

PPV - IR_precision: positive predictive value, precision

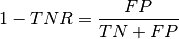
TNR - True_negative_rate: true negative rate, specificity

NPV - Non_IR_precision: negative predictive value

FPR - False_positive_rate: false positive rate
FNR - False_negative_rate: false negative rate
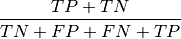
accuracy - Percent_correct: rate of correct classified examples (sometimes percent correct)
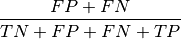
misclassification rate - Percent_incorrect: error rate, (sometimes percent incorrect)
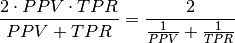
F-Measure - F_measure: harmonic mean of TNR and NPV
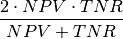
F-neg-measure - Non_IR_F_measure: F-measure for negative class
Weighted F-measure - not implemented yet: 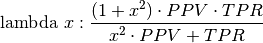
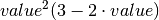
Weighted accuracy (t) - Weighted_accuracy(t): 
ROC-measure: 
balanced accuracy - Balanced_accuracy: 
Gmean: 
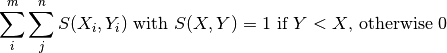
AUC: The area under the Receiver Operator Characteristic. Equal to the Wilcoxon test of ranks or to the probability, that a classifier will rank a randomly chosen positive instance higher than a randomly chosen negative one.
MCC- Matthews_correlation_coefficient: 
Cohen’s kappa-Kappa: Measures the agreement between classifier and true class with a correction for guessing
- K-metrics
These metrics expect classification values between zero and one. Instead of calculating the number of correct classifications, the corresponding sums of classification values are built. The misclassification values we get, by using one minus c-value. This also defines a confusion matrix, which is used to calculate the upper metrics.
the notation is k_ + normal name of metric.
- Loss metrics
Some classifiers like LDA, SVM and RMM have loss terms in there model description. These misclassification values can be also calculated on test data, to evaluate the algorithm.
The longest name used is loss_balanced_rest_L1_SVM and the shortest is loss_L2.
In the LDA case, you skip the SVM component. If you want to weight the losses equally and not consider class imbalance, skip the balanced component and if you do not want to restrict the maximum loss, delete the rest component.
The parameters calc_loss and loss_restriction can be specified.
Parameters
dataset_md: The meta data of the current input
(optional, default: None)
Author: Mario Krell (mario.krell@dfki.de) Created: 2010/04/01 Class Components Summary
add_split(performance, train[, split, run])Add a split to this dataset calculate_AUC(classification_outcome, ...[, ...])AUC and ROC points by an algorithm from Fawcett, calculate_confusion_metrics(performance[, ...])Calculate each performance metric resulting from the 4 values in the confusion matrix and return it. calculate_metrics(classification_results[, ...])Calculate performance measures from the given classifications get_average_performance(metric)Returns the average performance for the given metric get_performance_std(metric)Returns the average performance for the given metric get_unified_confusion_matrix_performance(metric)Confusion metrics from the splits altogether k_sig(value[, decision_boundary, scaling])Scaling as in Keerthi 2006 for smooth target function merge_performance(p_list)Replace performances of different splits by just one performance value merge_splits()Replace performances of different splits by just one performance value mutual_information(TN, FN, TP, FP)Computes the mutual information metric I(T;Y) = H(T) - H(T|Y) normalized_mutual_information(TN, FN, TP, FP)Normalized mutual information IN(T;Y) = (H(T) - H(T|Y))/H(T) pol(value[, decision_boundary])Scales the prediction output to [0,1] SMOOTH with a polynomial function to show there reliability contribution in the prediction. scale(value[, decision_boundary])Scales the prediction output to [0,1] by simple cutting to show there reliability contribution in the prediction. sig(value[, decision_boundary])Scales the prediction output to [0,1] SMOOTH with a sinusoid function to show there reliability contribution in the prediction. store(result_dir[, s_format])Handle meta data and meta information and save result as csv table update_confusion_matrix(...[, ...])Calculate the change in the 4 basic metrics: TP, FP, TN, FN update_loss_values(classification_vector, label)Calculate classifier loss terms on test data -
data= None¶ The data structure containing the actual data.
The data is stored as a dictionary that maps (run, split, train/test) tuple to the actual data obtained in this split in this run for training/testing.
-
meta_data= None¶ A dictionary containing some default meta data for the respective dataset
-
store(result_dir, s_format='csv')[source]¶ Handle meta data and meta information and save result as csv table
This table is later on merged with the other results to one big result table.
-
add_split(performance, train, split=0, run=0)[source]¶ Add a split to this dataset
The method expects the following parameters:
Parameters
performance: dictionary of performance measures
train: If train is True, this sample has already been used for training.
split: The number of the split this sample belongs to.
(optional, default: 0)
run: The run number this performance belongs to.
(optional, default: 0)
-
merge_splits()[source]¶ Replace performances of different splits by just one performance value
Performances of confusion matrix metrics are calculated by summing up the confusion matrix entries. The other metrics are averaged.
This method is the preparation of the merge_performance method.
-
merge_performance(p_list)[source]¶ Replace performances of different splits by just one performance value
Performances of confusion matrix metrics are calculated by summing up the confusion matrix entries. The other metrics are averaged.
-
get_unified_confusion_matrix_performance(metric)[source]¶ Confusion metrics from the splits altogether
-
static
calculate_metrics(classification_results, calc_soft_metrics=True, invert_classification=False, ir_class='Target', sec_class=None, loss_restriction=2.0, time_periods=[], calc_AUC=True, calc_loss=True, weight=0.5, save_roc_points=False, decision_boundary=0.0, scaling=5)[source]¶ Calculate performance measures from the given classifications
Returns: metricdict and the ROC points if save_roc_point is True
-
static
update_confusion_matrix(classification_vector, label, calc_soft_metrics=False, ir_class='Target', sec_class='Standard', confusion_matrix=defaultdict(<type 'float'>, {}), decision_boundary=0.0, scaling=5)[source]¶ Calculate the change in the 4 basic metrics: TP, FP, TN, FN
class|guess ir sec ir_class TP FN sec_class FP TN The change is directly written into the confusion matrix dictionary.
Returns: confusion_matrix
-
static
scale(value, decision_boundary=0.0)[source]¶ Scales the prediction output to [0,1] by simple cutting to show there reliability contribution in the prediction.
-
static
sig(value, decision_boundary=0.0)[source]¶ Scales the prediction output to [0,1] SMOOTH with a sinusoid function to show there reliability contribution in the prediction.
Therefore it uses the sinusoid sigmoid function

-
static
pol(value, decision_boundary=0.0)[source]¶ Scales the prediction output to [0,1] SMOOTH with a polynomial function to show there reliability contribution in the prediction.
Therefore it uses the polynomial sigmoid function
-
static
k_sig(value, decision_boundary=0.0, scaling=5)[source]¶ Scaling as in Keerthi 2006 for smooth target function
“An efficient method for gradient-based adaptation of hyperparameters in SVM models” Keerthi, S. Sathiya; Sindhwani, Vikas; Chapelle, Olivier
-
static
update_loss_values(classification_vector, label, ir_class='Target', sec_class='Standard', loss_dict=defaultdict(<function <lambda>>, {}), loss_restriction=2.0)[source]¶ Calculate classifier loss terms on test data
Different classifiers mapping the ir_class to 1 and the other class to -1 try to minimize a loss term in the classification. For some used loss terms of least squares classifiers and SVMs the corresponding value is calculated as a metric to be later on used for optimization.
-
static
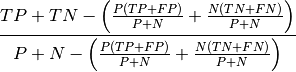
calculate_confusion_metrics(performance, pre='', P=None, N=None, weight=0.5)[source]¶ Calculate each performance metric resulting from the 4 values in the confusion matrix and return it.
This helps to use soft metrics, generating the confusion matrix in a different way.
Warning
Still the number of positive and negative instances had to be used for the calculation of rates with soft metrics.
Returns: metricdict Note
If the input is a metricdict the new calculated entries are added to it.
-
static
calculate_AUC(classification_outcome, ir_class, save_roc_points, performance, inverse_ordering=False)[source]¶ AUC and ROC points by an algorithm from Fawcett, “An introduction to ROC analysis”, 2005 Also possible would be to calculate the Mann-Whitney-U-Statistik
-
static
mutual_information(TN, FN, TP, FP)[source]¶ Computes the mutual information metric I(T;Y) = H(T) - H(T|Y)
Measures the mutual information between the classifier output Y and the target (the true label T), i.e. how many bits the classifier’s output conveys about the target. H denotes the entropy function.
MultinomialClassificationDataset
-
class
pySPACE.resources.dataset_defs.metric.MultinomialClassificationDataset(dataset_md=None, dataset_pattern=None)[source]¶ Bases:
pySPACE.resources.dataset_defs.metric.BinaryClassificationDatasetHandle and store multiclass classification performance measures
Metrics
Balanced accuracy, accuracy and weighted accuracy are calculated as in the Binary case.
Accuracy: Number of correct classifications devided by total number of classified samples
Balanced_accuracy: Mean of True positive rates for all classes
Weighted_accuracy: Weighted sum of True positive rates for all classes, using the weight parameter
Matthews_correlation_coefficient: Pearson’s correlation coefficient between classification and true label matrix.
- Paper: Comparing two K-category assignments by a K-category correlation coefficient
- Author: J. Gorodkin
- Page: 369
- Webpage: http://dx.doi.org/10.1016/j.compbiolchem.2004.09.006
micro/macro_average_F_measure: - Paper: A Study on Threshold Selection for Multi-label Classification
- Author: Rong-En Fan and Chih-Jen Lin
- Page: 4
Author: Mario Michael Krell Created: 2012/11/02 Class Components Summary
calculate_confusion_metrics(performance, classes)Calculate metrics of multinomial confusion matrix calculate_metrics(classification_results[, ...])Calculate performance measures from the given classifications update_confusion_matrix(...[, confusion_matrix])Calculate the change in the confusion matrix -
static
calculate_metrics(classification_results, time_periods=[], weight=None, classes=[])[source]¶ Calculate performance measures from the given classifications
-
static
update_confusion_matrix(classification_vector, label, confusion_matrix=defaultdict(<type 'float'>, {}))[source]¶ Calculate the change in the confusion matrix
class|guess c1 c2 c1 T:c1_P:c1 T:c1_P:c2 c2 T:c2_P:c1 T:c2_P:c2 The change is directly written into the confusion matrix dictionary.
Returns: confusion_matrix
RegressionDataset
-
class
pySPACE.resources.dataset_defs.metric.RegressionDataset(dataset_md=None, dataset_pattern=None)[source]¶ Bases:
pySPACE.resources.dataset_defs.metric.BinaryClassificationDatasetCalculate 1-dimensional and n-dimensional regression metrics
Metrics for 1-dim regression were taken from:
- Book: Data mining: practical machine learning tools and techniques
- Authors: I. H. Witten and E. Frank
- Page: 178
- Publisher: Morgan Kaufmann, San Francisco
- year: 2005
n-dimensional metrics were variants derived by Mario Michael Krell:
micro
For the correlation coefficient, the components were treated like single regression results. For the other metrics, differences and means are taken element or component wise and at the final averaging stage the mean is taken over all components.
component_i_metric
For each dimension, performance values are calculated separately.
macro
The component wise metrics were averaged.
Author: Mario Michael Krell Created: 2012/11/02 Class Components Summary
calculate_metrics(regression_results[, ...])Calculate performance measures from the given classifications